
China's Two-Track Economy: New Energy Vehicle Boom Masks Property-Led Slowdown
China's Two-Track Economy: New Energy Vehicle Boom Masks Property-Led Slowdown NEV Production Records China’s new energy vehicle sector posted record figures in the first half of 2026. Production reached 7.438 million units, a 6.7 percent increase from the same period a year earlier, according to the China Association of Automobile Manufacturers. Sales totaled 7.446 million uni
China's Two-Track Economy: New Energy Vehicle Boom Masks Property-Led Slowdown
NEV Production Records
China’s new energy vehicle sector posted record figures in the first half of 2026. Production reached 7.438 million units, a 6.7 percent increase from the same period a year earlier, according to the China Association of Automobile Manufacturers. Sales totaled 7.446 million units, up 7.3 percent year on year. These gains occurred against a backdrop of continued policy support for electrification and expanded charging infrastructure across major provinces. The June alone saw 1.643 million units sold, representing a 23.6 percent year-on-year rise and capturing 58.5 percent of the overall passenger vehicle market. Such momentum reflects sustained domestic demand for battery electric and plug-in hybrid models amid improving battery technology and lower operating costs. Government targets under the 14th Five-Year Plan have prioritized NEV adoption, contributing to the sector’s resilience even as broader manufacturing indicators softened. Fixed-asset investment in high-tech manufacturing continued to expand rapidly, providing additional tailwinds for component suppliers and assembly lines. The combination of volume growth and rising market share underscores the sector’s role as a key driver within China’s industrial landscape during the first half of the year.
Year-on-year comparisons reveal steady acceleration. The 6.7 percent production increase and 7.3 percent sales growth in H1 2026 built upon earlier recovery phases following pandemic disruptions. Policy measures, including purchase subsidies phased down rather than eliminated, maintained buyer incentives in lower-tier cities. Infrastructure buildout has been equally important, with new charging stations added at a pace exceeding 1 million units annually in recent years. This network expansion has reduced range anxiety and supported higher utilization rates for commercial fleets. Provincial governments have also introduced local tax exemptions and preferential parking policies that further stimulate uptake. The resulting ecosystem benefits not only vehicle makers but also upstream battery and semiconductor producers. Data from the first six months indicate that these coordinated efforts have created a self-reinforcing cycle of investment and consumption within the NEV segment.
June’s performance stood out even within the strong half-year results. The 1.643 million units sold translated into a 58.5 percent market share, illustrating how quickly electrified powertrains have displaced traditional internal-combustion models. This shift has been facilitated by aggressive pricing strategies from leading domestic manufacturers and continuous improvements in energy density. Infrastructure deployment has kept pace, with expressway fast-charging corridors now spanning most eastern and central provinces. Such connectivity supports long-distance travel and commercial logistics, widening the addressable market. The production side has responded with new gigafactories coming online in the first half, increasing capacity utilization rates. These developments collectively demonstrate how targeted industrial policy and infrastructure spending have sustained output growth despite softer overall fixed-asset investment figures.
High-tech manufacturing investment has provided critical underpinning. Although total fixed-asset investment excluding rural areas contracted 1.6 percent in the January-April period, the high-tech subset expanded at a brisk pace. This divergence highlights resource reallocation toward advanced sectors aligned with national strategic priorities. NEV supply chains have captured a disproportionate share of this capital expenditure, particularly in battery materials and power electronics. The resulting capacity additions have helped meet both domestic and export demand without significant bottlenecks. Policy continuity under the dual-circulation framework has further encouraged such investment by signaling long-term commitment to green mobility. Consequently, the NEV segment has emerged as a rare bright spot within an otherwise subdued investment environment.
Regional variation in adoption rates has also contributed to the sector’s performance. Coastal provinces with denser charging networks recorded higher penetration, while inland regions benefited from targeted subsidies for commercial vehicles. This geographic spread has helped maintain national momentum. The cumulative effect of these factors is visible in the June market-share figure of 58.5 percent, a level that would have seemed ambitious only a few years earlier. Continued infrastructure spending and policy support are expected to sustain these trends through the remainder of 2026.
Export Expansion
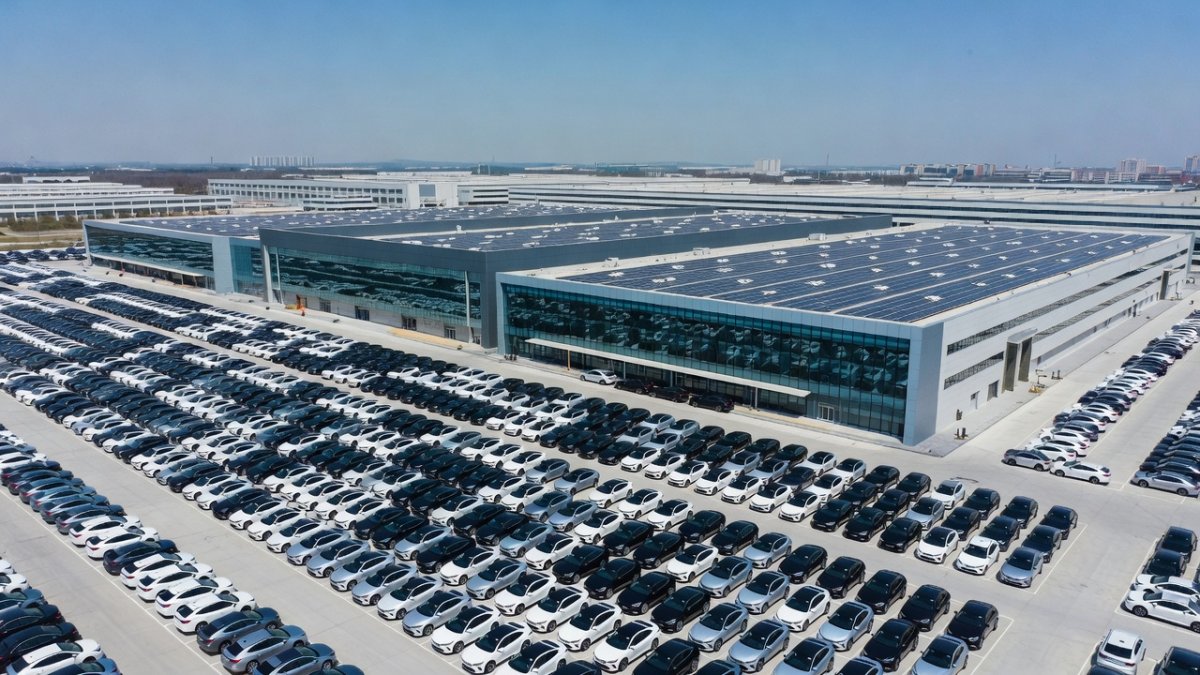
Chinese vehicle exports reached a new monthly milestone in June 2026. Total shipments hit 1.037 million units, the first time the monthly figure exceeded one million. New energy vehicles accounted for 523,000 of these exports, marking a 160 percent year-on-year increase. The half-year total for all vehicles stood at 5.096 million units, up 65.3 percent from the corresponding period in 2025. These numbers reflect both volume growth and a broadening geographic footprint. European and Southeast Asian markets absorbed significant shares, driven by competitive pricing and improving brand perception. Trade tensions have prompted some diversification of destination markets, yet overall export momentum has remained robust. The surge in NEV shipments in particular demonstrates how domestic overcapacity in certain segments is being redirected overseas.
Comparative market-share gains have been notable. Chinese brands now hold double-digit shares in several European countries where they were marginal players two years ago. This expansion has occurred alongside rising global demand for affordable electric vehicles amid tightening emissions regulations. Supply-chain advantages in battery production have allowed Chinese exporters to maintain cost leadership. However, the rapid increase has also drawn scrutiny from trade authorities in destination markets. Antidumping investigations and potential tariff adjustments remain live risks that could affect second-half volumes. Despite these headwinds, the June export data indicate that short-term demand continues to outpace policy frictions.
Global demand factors have aligned favorably. Many emerging economies lack domestic EV manufacturing capacity and therefore rely on imports to meet climate commitments. Chinese models offer lower price points than European or Japanese equivalents, accelerating adoption. In parallel, established automakers in traditional markets have faced their own production constraints, creating temporary openings. The 160 percent year-on-year jump in NEV exports for June captures this window of opportunity. Logistics improvements, including dedicated roll-on/roll-off vessel capacity, have further facilitated the volume increase. These structural tailwinds are expected to persist into the second half even if tariff regimes tighten.
Trade-tension context adds complexity. While export volumes have climbed, the risk of retaliatory measures has prompted Chinese firms to accelerate overseas assembly projects. Several manufacturers have announced joint ventures in Southeast Asia and Eastern Europe to circumvent potential barriers. The June milestone of over one million units exported in a single month therefore represents both achievement and a signal for future strategic adjustment. Policymakers in Beijing continue to emphasize the importance of export diversification as a buffer against domestic property weakness.
Property Contraction
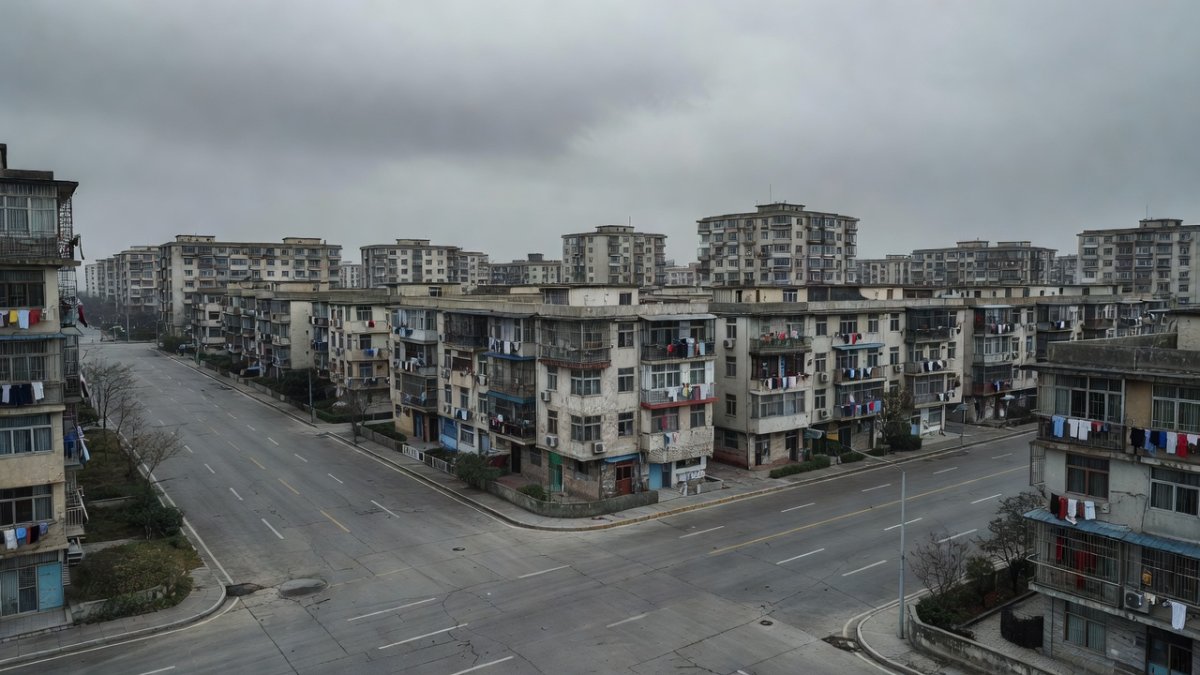
China’s property sector has now contracted for four consecutive years. Secondary home prices in 100 major cities declined 0.42 percent month on month in June, according to the China Index Academy. In Beijing, second-hand prices fell 8.30 percent year on year during the first quarter of 2026, data from the National Bureau of Statistics show. These figures illustrate the depth of the adjustment that began in 2022. Buyer sentiment remains cautious, with many households deferring purchases amid uncertainty over future price trajectories and employment prospects. Local government land sales revenue has consequently weakened, constraining fiscal space for infrastructure and social spending. The prolonged downturn has also weighed on related industries such as steel, cement, and home appliances, amplifying the drag on domestic consumption.
Historical depth places the current episode among the longest property adjustments in the post-reform era. Previous cycles typically lasted two to three years before policy easing restored momentum. The present contraction has persisted longer because of stricter developer leverage limits and slower household income growth. Regional variation is pronounced: tier-one cities have experienced sharper price corrections than some lower-tier cities where inventory levels were lower. Yet even in resilient markets, transaction volumes remain subdued. This uneven pattern complicates national policy responses, as measures effective in one region may prove insufficient elsewhere.
Fiscal implications have become increasingly visible. Land-transfer revenues, once a mainstay of local budgets, have fallen sharply. Many municipalities have responded by cutting capital expenditure or increasing debt issuance, raising concerns about hidden liabilities. The central government has introduced targeted support for completed but unsold housing projects, yet these measures have not yet reversed broader price trends. The 0.42 percent monthly decline recorded in June suggests that stabilization remains distant. Without a sustained recovery in transaction volumes, fiscal pressure on local governments is likely to intensify through the remainder of 2026.
Buyer deferral has created a feedback loop. Potential purchasers cite concerns over job security and future property values, leading to postponed decisions. This hesitation further depresses prices and transaction volumes, reinforcing negative sentiment. Developers have responded with deeper discounts, but these have yet to trigger a broad-based rebound. The resulting environment has also affected mortgage demand, with banks reporting slower new loan origination. These dynamics underscore how the property contraction has moved beyond the construction sector to influence household balance sheets and consumption patterns.
Regional variation continues to shape outcomes. Coastal cities with stronger employment bases have seen milder corrections, while inland cities dependent on heavy industry have faced steeper declines. This divergence affects the transmission of monetary policy, as lower-tier cities require more aggressive support to stabilize prices. National averages therefore mask significant local differences that policymakers must navigate carefully.
Structural Divergence
Aggregate indicators mask pronounced sectoral divergence. While high-tech manufacturing investment expanded, overall fixed-asset investment excluding rural areas contracted 1.6 percent in the first four months. Domestic consumption remained in negative territory, weighed down by property-related wealth effects. The IMF raised its 2026 China growth forecast to 4.6 percent, an upward revision of 0.2 percentage points, citing resilience in high-tech sectors. The World Bank, in its July 7 assessment, similarly highlighted the role of technology-intensive investment in offsetting property weakness. These forecasts acknowledge the two-track nature of the economy but also underscore the challenge of sustaining momentum if domestic demand fails to recover.
Policy challenges arise from the need to support the NEV sector without reigniting property speculation. Targeted credit measures have been deployed for green manufacturing, yet broader stimulus risks fueling renewed leverage in real estate. The IMF and World Bank analyses both emphasize the importance of structural reforms to rebalance growth toward consumption and services. Without such rebalancing, the divergence between high-tech and traditional sectors may widen further, complicating macroeconomic management.
IMF and World Bank assessments provide external validation of the current trajectory. Both institutions note that high-tech investment has provided a buffer, yet they caution that property sector drag could intensify if prices continue to fall. The 4.6 percent GDP projection assumes continued export strength and policy support for strategic industries. Any deterioration in external demand or escalation of trade tensions could prompt downward revisions later in the year.
The combination of resilient high-tech output and weak domestic consumption creates an unusual cyclical profile. Traditional demand-side indicators such as retail sales and housing starts remain soft, while supply-side metrics in advanced manufacturing show strength. This pattern suggests that growth is becoming more capital-intensive and less employment-intensive, with implications for household income and future consumption.
Japan Implications
Japanese automakers face direct competitive pressure from China’s NEV export surge. Toyota and Honda have both reported slower sales growth in Southeast Asian markets where Chinese models have gained share through aggressive pricing. METI has begun monitoring component supply chains for potential disruption, particularly in battery materials where Chinese dominance is pronounced. The 523,000 NEV units exported by China in June alone signal that the competitive threat is accelerating rather than receding.
Society 5.0 and GX strategies offer Japan partial offsets. Government-backed initiatives to accelerate domestic hydrogen and next-generation battery development aim to differentiate Japanese technology. METI funding has increased for pilot projects that integrate renewable energy with mobility solutions, seeking to create niches less exposed to Chinese scale advantages. These programs require sustained budgetary commitment through the medium term.
Supply-chain exposure in ASEAN has become a focal point. Many Japanese suppliers maintain production bases in Thailand and Indonesia that now compete with incoming Chinese investment. METI has encouraged diversification toward India and Mexico to reduce concentration risk. The June export milestone from China underscores the urgency of these adjustments.
US-China tariff developments carry secondary effects for Japan. Any escalation could redirect Chinese exports toward markets where Japanese firms currently hold stronger positions. BOJ officials have noted that prolonged weakness in China’s property sector may dampen regional demand, affecting Japanese machinery and materials exporters. Coordination between METI and the BOJ on supply-chain resilience has therefore intensified.
Domestic Japanese consumption patterns are also indirectly influenced. Lower Chinese property prices have reduced demand for Japanese luxury goods and tourism, contributing to softer inbound spending. METI’s quarterly surveys show exporters revising downward their China-related revenue forecasts for the second half of 2026.
Strategic options for Japanese firms include deeper localization and technology partnerships. Several suppliers are exploring joint ventures that combine Japanese quality control with Chinese manufacturing scale. These arrangements aim to capture value even as pure export competition intensifies.
Outlook
Second-half 2026 expectations hinge on whether NEV export momentum can offset continued property contraction. June’s record vehicle shipments provide a positive base, yet analysts caution that trade remedies could curb further acceleration. Domestic consumption is projected to remain subdued absent clearer signs of property stabilization.
Medium-term risks center on the sustainability of high-tech investment-led growth. If global demand for Chinese NEVs encounters tariff barriers, the sector’s contribution to GDP could moderate. The IMF’s 4.6 percent forecast assumes no major external shocks; any escalation would likely prompt revisions.
Japan’s strategic options include accelerated GX investment and selective supply-chain relocation. METI continues to prioritize technology differentiation in areas where Chinese cost advantages are smaller. Close monitoring of BOJ policy responses to regional demand weakness will also be required.
Overall, China’s two-track economy is expected to persist through 2026. The NEV sector will remain the primary growth engine, while property-related drag continues to constrain broader consumption and investment. Japanese stakeholders must navigate this divergence with targeted industrial and trade strategies.
By Kenji Tanaka, Staff Writer
This article was produced with AI-assisted research and editorial support. Reporting is based on sources cited in the article.
What's Your Reaction?
 Like
0
Like
0
 Dislike
0
Dislike
0
 Love
0
Love
0
 Funny
0
Funny
0
 Wow
0
Wow
0
 Sad
0
Sad
0
 Angry
0
Angry
0

Japan Correspondent at Global1.News. Tokyo-based voice covering Japanese politics, technology, economy, and culture. Tracks the intersection of tradition and innovation in one of the world's most dynamic societies.















Comments (0)