
IRS Lifts 2027 Tax Brackets 3.2% and Raises the Standard Deduction to $16,600
Federal tax brackets widen about 3.2% for 2027, the standard deduction rises to $16,600 for single filers, and the child tax credit climbs to $2,300, in the IRS's annual inflation reset published two days after the midterms.

Washington just moved every number that decides what you owe. The Internal Revenue Service published its 2027 inflation adjustments on Thursday, and the headline is a 3.2 percent lift across all seven income-tax brackets. The rates themselves are untouched — still 10 percent at the bottom, still 37 at the top. What changed is where each one starts.
IRS Lifts 2027 Tax Brackets 3.2% and Raises the Standard Deduction to $16,600
WASHINGTON — The Internal Revenue Service released its annual inflation adjustments for tax year 2027 on Thursday, widening every bracket threshold, raising the standard deduction by $500 for a single filer, and adjusting roughly 70 provisions of the tax code. The figures apply to income earned next year and to the returns most Americans will file in early 2028. The return due this coming spring still runs on the 2026 numbers.
The Numbers That Move
For a single filer, the 10 percent rate now covers taxable income up to $12,800, up from $12,400. The 12 percent band runs to $52,025. The 22 percent band ends at $109,125, the 24 percent at $208,325, the 32 percent at $264,550, and the 35 percent at $661,375. Everything above that is taxed at 37 percent.
Married couples filing jointly see the same shape at roughly double the width. The 10 percent rate covers income up to $25,600, the 12 percent band reaches $104,050, the 22 percent reaches $218,250, the 24 percent reaches $416,650, and the 32 percent reaches $529,100. The 35 percent band ends at $793,650, and the top rate begins above it.
Read those as ceilings, not as rates applied to the whole paycheck. Each band taxes only the slice of income inside it, which is why a household in the 24 percent bracket pays 24 percent on a fraction of its earnings and a much lower average rate overall.
What the Standard Deduction Is Worth
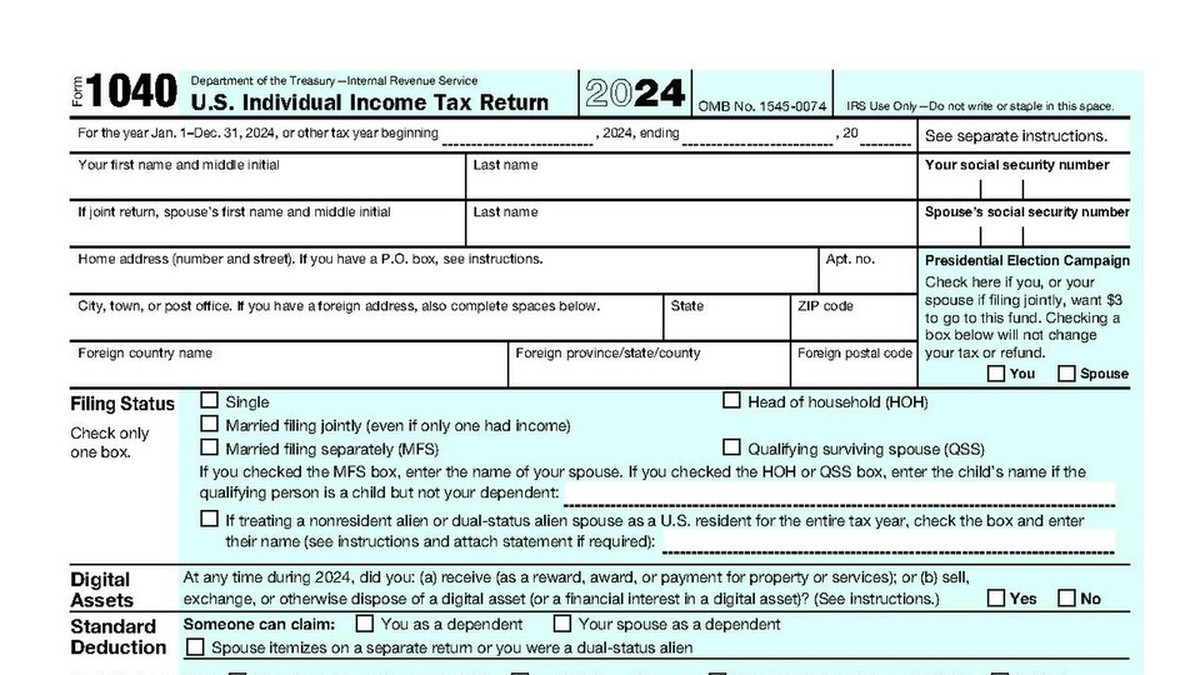
The standard deduction — the flat amount nearly nine in ten taxpayers subtract instead of itemizing — rises to $16,600 for single filers and married people filing separately, $33,200 for married couples filing jointly, and $24,925 for heads of household.
That is $500 more than the 2026 figure of $16,100 for a single filer, and $1,000 more than the $32,200 joint amount. The head-of-household figure climbs from $24,150.
For most households this number matters more than any single bracket edge. A filer who takes the standard deduction shields that income from tax entirely, then pays the graduated rates on whatever is left. The Tax Foundation estimates that about 86 percent of taxpayers will claim it for 2026, which makes the annual adjustment the single most consequential line in the package for the broad middle of the country.
Nothing about qualifying changed. The deduction is still available to anyone who does not itemize, and it still comes with the additional amounts for filers who are 65 or older or blind.
Why 3.2 Percent Is the Real Story
The adjustment is not a tax cut passed by anyone. It is the annual recalibration that keeps inflation from quietly pushing people into higher rates as their pay rises with the cost of living — a mechanism called bracket creep.
And the size of the recalibration is itself a reading on prices. A 3.2 percent adjustment is a bigger step than the 2.7 percent applied for 2026, though far smaller than the roughly 7 percent jump that followed the white-hot inflation of 2022.
The calculation runs on the chained consumer price index, a measure that accounts for shoppers substituting cheaper goods when prices climb. Congress switched the tax code to that gauge starting in 2018, and it generally rises a bit more slowly than the headline CPI that fills the news.
The measurement window runs from September through August. Whatever the index does after that is irrelevant to next year's tables — it feeds the year after.
The Energy Bill Behind the Math
The number that drove this adjustment is visible at the pump. Consumer prices rose 3.7 percent in the twelve months to September, with gasoline doing much of the pushing as energy costs climbed through the standoff with Iran.
The same pressure showed up in the Social Security Administration's announcement last month: a 3.6 percent cost-of-living increase for 2027, up from 2.8 percent for this year. Two different indexes, two different formulas, one direction.
That matters for how you read Thursday's release. The brackets widened because prices rose, not because anyone decided taxpayers deserved relief. For a household whose pay grew faster than 3.2 percent, the adjustment is a partial shield. For one whose pay grew slower — or not at all — it changes very little, because a wider bracket only helps if there is more income to place in it.

Three Credits That Also Moved
The child tax credit rises to $2,300 per qualifying child, up $100. The refundable portion — the additional child tax credit, which is what actually reaches families who owe little or nothing — climbs to $1,800 from $1,700.
The maximum earned income tax credit rises to $8,496 for a taxpayer with three or more qualifying children, from $8,231. Smaller amounts apply at lower child counts and for workers without children.
These are the provisions that move money for households at the bottom of the income scale, where the bracket tables barely reach. A family whose income is low enough to owe no federal income tax still sees the refundable credits, which is why the credit figures carry more practical weight for them than the 10 percent ceiling does.
Both credits are indexed to inflation, so the increases arrive without a new vote. The child credit's larger base traces to the 2025 tax law, which lifted it and then tied it to the index.
The SALT Cap Steps Up Again
One number in the package follows a calendar rather than an index. The cap on the state and local tax deduction — the write-off that matters most in high-tax states — rises to $40,804 for 2027, and the income level at which the full deduction begins phasing out moves up to $510,050.
Those increases are not tied to inflation. The 2025 law set the cap at $40,000 and wrote in 1 percent annual steps through 2029, which produced $40,400 for 2026 and produces $40,804 for next year. The phase-out threshold for 2026 sits at $505,000.
The distinction is worth holding onto. If prices surge, the SALT cap will not respond; if prices cool, it will keep climbing anyway. For a household in a high-tax state weighing whether to itemize, that makes the SALT figure and the standard deduction a paired decision, and next year both move in the same direction by different logic.
What This Means at $100,000
Take a single filer with $100,000 of wages, no other income, and the standard deduction.
For 2026, that filer subtracts $16,100 and owes federal income tax of about $13,170. For 2027, the deduction becomes $16,600 and the brackets widen, and the same filer owes about $12,890.
That is a saving of roughly $281, or about $11 per biweekly paycheck, on identical earnings. It is real money, and it is also small enough that most people will not notice it in a single paycheck.
The mechanism is worth spelling out: part of the gain comes from the larger deduction, which lowers taxable income, and part comes from the wider bands, which leave less income sitting in the 22 percent slice. Neither piece changes the rate. Together they trim the bill.
A Shutdown Fingerprint on the Calculation
This year's math carried a complication the tables do not show. The Bureau of Labor Statistics never published an October 2025 inflation reading because of the federal government shutdown, leaving a hole in a calculation built on twelve consecutive months of data.
Forecasters who model these figures in advance handled the gap differently, which is why the outside projections circulating since September disagreed at the edges — particularly on the head-of-household standard deduction, where the rounding rules left more than one defensible answer.
The published figures are the ones that count. But the episode is a useful reminder that these tables are arithmetic applied to a price index, and that the index is produced by an agency that can be interrupted.

The Politics of a Quiet Adjustment
Thursday's release landed two days after the midterm elections, in which gasoline prices and the cost of living weighed heavily on voters.
It also marks the second full year under the 2025 tax law, which made the seven rates permanent instead of letting them expire on schedule, and raised the standard deduction. The agency has promoted that law hard: in its own year-end review on October 29, the IRS credited what it calls President Donald J. Trump's landmark Working Families Tax Cuts with the highest tax revenue and the largest refunds in its history.
That framing is contestable and worth stating plainly: rates did not fall this week, and no one voted on Thursday's numbers. What the law did was lock the rate structure in place so that the annual adjustment is now the only thing moving — which means the agency's autumn arithmetic, not a floor vote, is what shifts most households' bills from year to year.
What Happens Next, and What Does Not
Nothing changes for the return you file this coming spring. The 2026 brackets and the $16,100 standard deduction still govern that filing.
Employers and payroll processors will begin folding the 2027 tables into withholding next year, which is when most workers will first feel the difference — usually as a few dollars more per pay period, not as a visible event.
Still outstanding: the retirement account limits. The IRS announces 401(k) and IRA contribution caps separately each November, and those figures have not yet been published.
For now the practical takeaway is narrow and unglamorous. If you are planning income, charitable giving, or a Roth conversion across the year boundary, the new thresholds are the ones to use for anything dated 2027 — and the old ones still apply to everything dated before it.
By Jessica Ali, Staff Writer
This article was produced with AI-assisted research and editorial support. Sources: Internal Revenue Service (2027 inflation adjustments; Revenue Procedure 2025-32 for 2026 figures), Money, MarketWatch/Dow Jones Newswires, The College Investor, Social Security Administration, Bureau of Labor Statistics, Tax Foundation. Photographs: G. Edward Johnson via Wikimedia Commons (CC BY 4.0); Internal Revenue Service (public domain); The Bushranger via Wikimedia Commons (CC BY-SA 4.0). Cover: Global 1 News editorial image.
What's Your Reaction?
 Like
0
 Dislike
0
 Love
0
 Funny
0
 Wow
0
 Sad
0
 Angry
0

Editor-in-Chief at Global1.News. Atlanta-based journalist who cuts through the BS and tells it like it is. Lead anchor, host, and the voice you hear when the spin stops and the truth starts.















Comments (0)